Tracking down the cause of high VMWare network traffic using pktcap-uw
The other day we started to see an odd issue on a VMWare host.
We have a lot of monitoring in place so the issue was picked up pretty quickly.
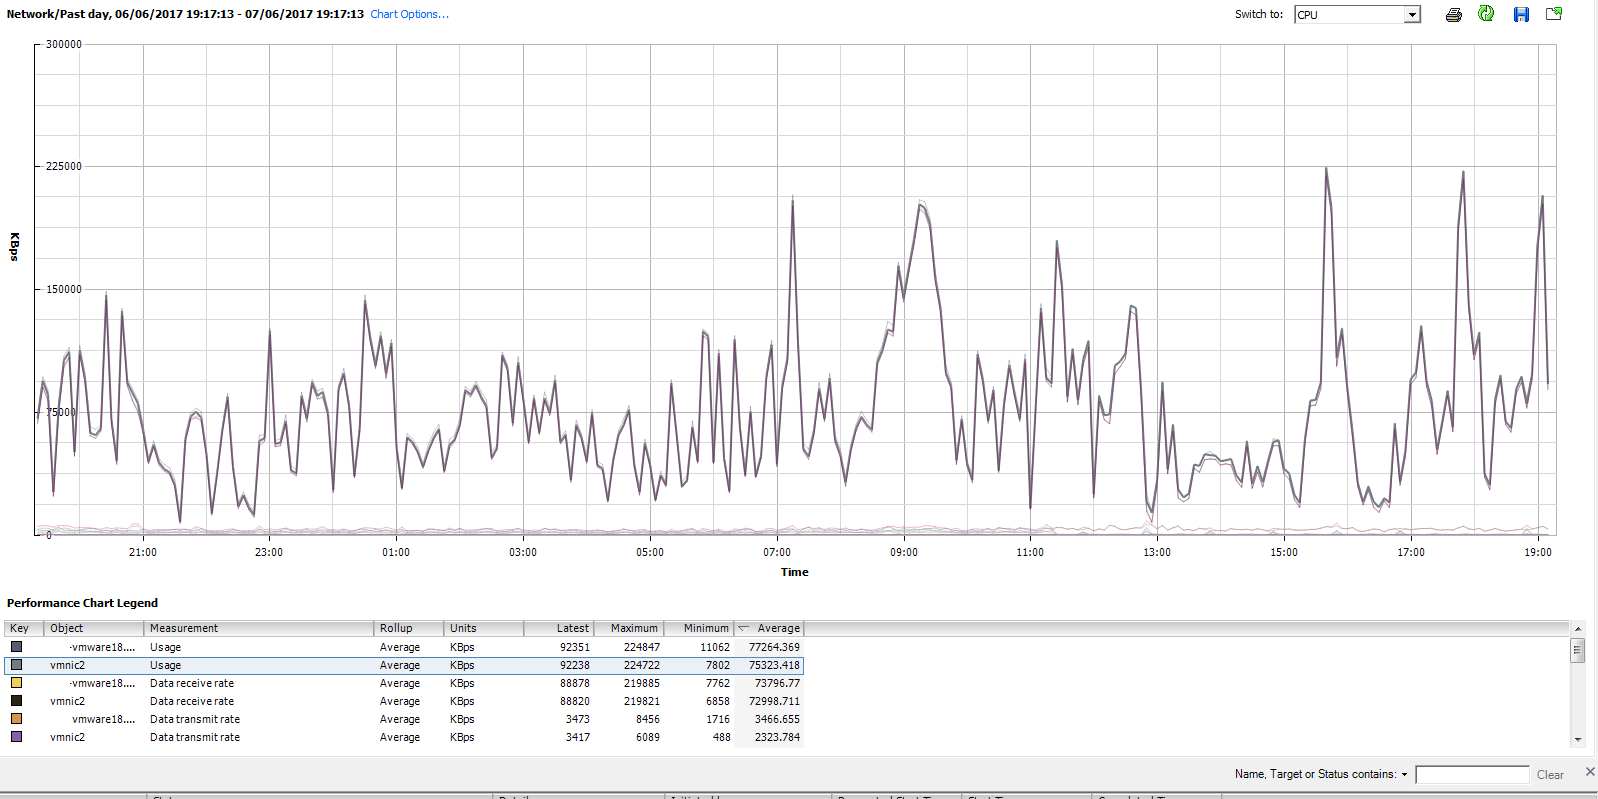
This is the one of the graphs that had us scratching our heads, what we were seeing was very high traffic on VMNIC2. On this server, VMNIC2 and VMNIC3 are in a VPID team so the VM's on the host should be deployed with roughly half on one pNIC and the other half on the other pNIC.
The network performance graph showed that whatever the traffic was, it was hitting something on VMNIC2 and not on VMNIC3. My first thought was that we were seeing some sort of large amounts of re-transmits due to a fault, however, the switches that the nics were plugged in to showed no problems at all.
VMWare's performance charts allow for a "stacked graph by VM", this is a great way to see the traffic load per VM and using this it's generally very easy to see which VM is being the noisy neighbour.
In this case, the graph that we got back was weird.
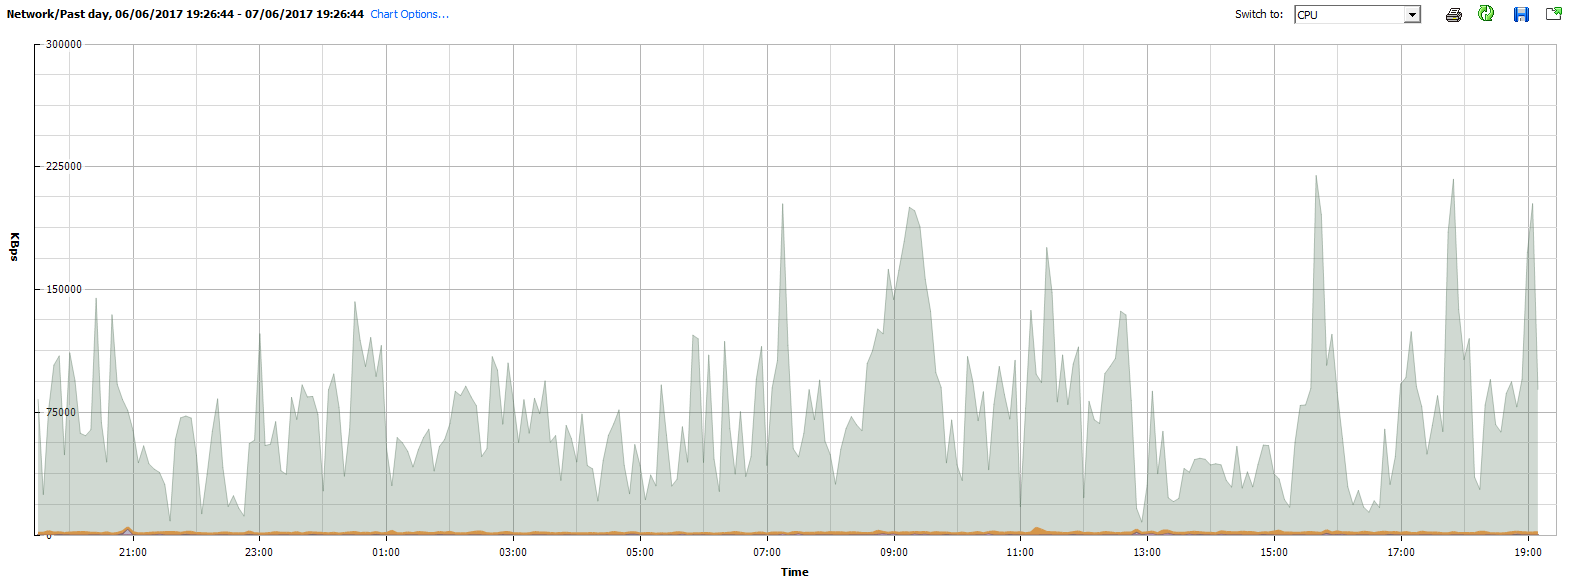
The small yellow line at the bottom of the graph is the network traffic for ALL the VM's. The spiky graph above it, is the host traffic. According to VMWare there was no VM responsible for this traffic spike, it was the host itself.
Admittedly, at this point I was kind of at a loss. The traffic was being sent TO the host and no VM was responsible. It looked like something was spamming the host. One cause for traffic hitting a host is VMotion but there were no vmotions happening on this host so I was back to square one.
At this point, twitter came to the rescue and I owe a thank you to t0x0pg who suggested that I run pktcap-uw on the host itself which involves enabling the ESXI shell and SSH then connecting to the host over SSH and outputting about five minutes worth of network traffic to a datastore.
On the host, changing directory to a datastore with plenty of space and running the command:
pktcap-uw --uplink vmnic2 -o vmnic2.pcap
started to generate a network trace of everything hitting VMNIC2. Leaving that for five minutes gave me a nice, near 300MB pcap file. Downloading this and opening it in wireshark was an instant eye opener:
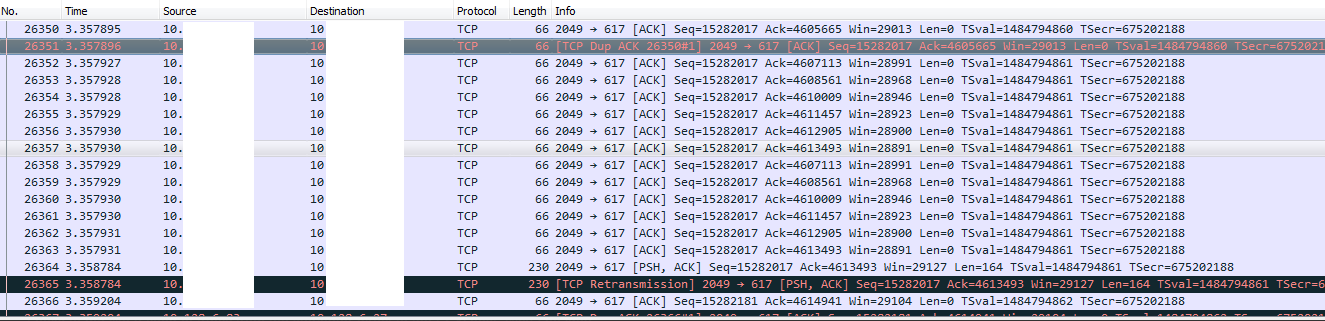
I've obfuscated the network details for obvious reasons, the source address in this example is an NFS datastore, the destination is the ESXi host. The sequence number immediately told me that there was a lot of traffic going between the NFS storage and the ESXi host and was most likely the main cause of the network spike.
The root cause turned out to be a large amount of traffic relating to a DFS server and the NFS datastore talking to the ESXi host. I need to do more digging on the DFS server as it never showed any sort of high traffic so I'm not sure why the storage was sending to the ESXi host and not the VM. Clearly, this was purely storage traffic but I still want to trace back what actually triggered it and what the VM was up to.
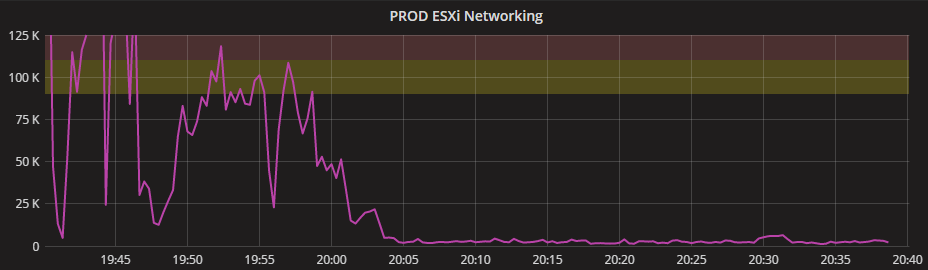
However, turning off the DFS VM immediately stopped the traffic and that could be seen on another graph that we use for monitoring the networking on all hosts:
I wasn't fully aware of pktcap-uw until I was told about it on twitter and it's a very powerful tool that was added to ESXi 5.5 and above. It certainly saves a lot of messing around with port mirroring and so on. It's a very nice addition to the ESXi tool set, you can read more details on it here.
This sort of traffic spike also highlights how VPID works as all the traffic was pinned to a single pnic simply because VPID picks a pnic and uses that until something changes to the nic setup in VMware. It also shows that having dedicated storage pnics is a very good idea no matter the storage protocol you use for remote datastores.
Subscribe to Ramblings of a Sysadmin
Get the latest posts delivered right to your inbox